Why reference climatologies?
Historical climate data are useful to characterise the typical seasonality and identify a range of temporal variability in any meteorological variable. Such information therefore provides the historical context of climatic risk.
One critical piece of context when monitoring or forecasting climate conditions, extremes or hazards, as well as expected impacts, is climatological norms. Climatological norms present information on summary statistics, including but not limited to historical averages, extremes, frequency, annual ranges, as well as related statistics.
These norms allow us to identify the timing of the different seasons (i.e., wet/dry seasons, heat/cool seasons, hurricane season), their characteristics (i.e., the usual range, maximum/minimum values, interannual variability of meteorological variables or derived indices) and decadal-scale trends. This, in turn, allows for the characterisation of seasonality in climate-related hazards.
Since our climate is changing, globally (see the IPCC Assessment Report 6’s 2021 publication available at https://www.ipcc.ch/report/ar6/wg1/), regionally (see e.g., State of the Caribbean Climate in 2019 Report available at https://www.caribank.org/publications-and-resources/resource-library/publications/state-caribbean-climate) and nationally throughout the Caribbean (see e.g., Climate Trends and Projections for the OECS Region and OECS CCASAP Country Profiles), climatological norms should be updated on a regular basis.
Reference climatologies (1991-2020) – Monthly average rainfall totals and mean temperatures
The World Meteorological Organization (WMO) designated Regional Climate Centre for the Caribbean (Caribbean RCC) provides updated climatological norms every ten years, with the current norms for reference climatologies being 1991-2020.
Reference climatologies adhere to the highest global standard defined in the WMO Guidelines on the Calculation of Climate Normals (WMO-No. 1203). In terms of data, this standard pertains to the meteorological observations being made under standard conditions, to the completeness and homogeneity of the station record, for at least 2 variables, namely rainfall totals and daily mean temperatures averaged for each month.
Among the most important determinants of the 1991-2020 reference climatologies are that they be calculated from daily records – e.g., rainfall totals, minimum temperatures and maximum temperatures. In the Caribbean, this limits the regional coverage of station reference climatologies as most station data are either maintained by NMHSs and/or shared with the Caribbean RCC in monthly means.
With this in mind and as mandated by the WMO, the Caribbean RCC provides the 1991-2020 reference climatologies for monthly average rainfall totals and monthly average minimum, mean and maximum temperatures.
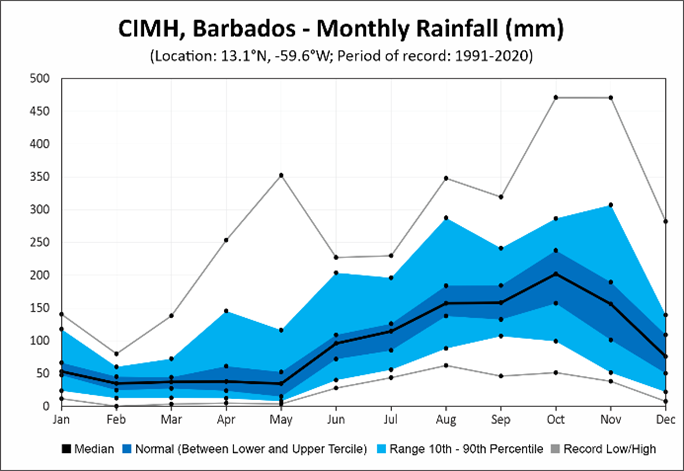
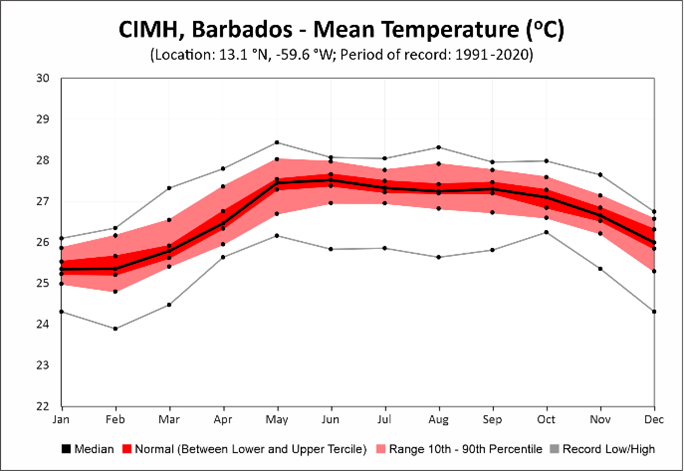
Figure 1 – 1991-2020 Reference Climatology of monthly average rainfall totals and monthly average mean temperatures. Depicted on the graphs are the median, terciles, 10th and 90th percentiles and lowest and highest observed values for each month in the 30-year period.
The above graphs present the reference climatologies for rainfall totals and mean temperature at the CIMH weather station in Barbados. On the X-axis, one sees the months of the year, while the Y-axis depicts either the range of monthly rainfall totals in millimetres or mean temperature in degrees Celsius.
The thick black line on the graph represents the median of all monthly values, i.e. the threshold above which and below which 50% of all observations in the 30-year period are found. The blue and red bands indicate what in climate forecasting terms is often called the ‘normal (or usual) range’, i.e. the values between the first and second tercile. Then, the values at the upper and lower extremes of the light blue and light red bands denote the 10% lowest and highest values per month, i.e. the 10th and 90th percentiles. Finally, the grey lines show the single lowest and highest values observed for a month in the 30-year period. The former two – median and near-normal – are indicative to typical conditions whereas the latter two – 10th/90th percentiles and lowest/highest values – are indicative of extremes.


